


The Analytics Dashboard is your central hub for measuring every aspect of Order Editing on your store. It covers all core functions of the app in one place, from self-service customer edits and support savings through to upsell revenue, conversion rates, and payment capture.
Whether you want to understand how many support tickets your customers are solving themselves or how much additional revenue your upsell strategies are generating, this is where you find it.
Access your dashboard from Order Editing > Analytics in your Shopify admin.
️ Note: Extended date ranges require the extra analytics permission shown in the app. Without that permission, you'll see the standard recent date ranges. With it, you can use longer ranges such as Last 90 days, This year, Last year, and Lifetime.
How Analytics Tracking Works
Order Editing uses analytics events and Shopify order data to report on customer activity, including product additions, address changes, completed edits, upsell revenue, and payment capture performance. This gives you a complete view of which features drive engagement and which go unused.
No setup is required for standard analytics. Data starts populating as customers interact with your Order Editing features. Some advanced reporting, including longer date ranges and AOV impact charts, may ask you to grant extra Shopify permissions inside the app.
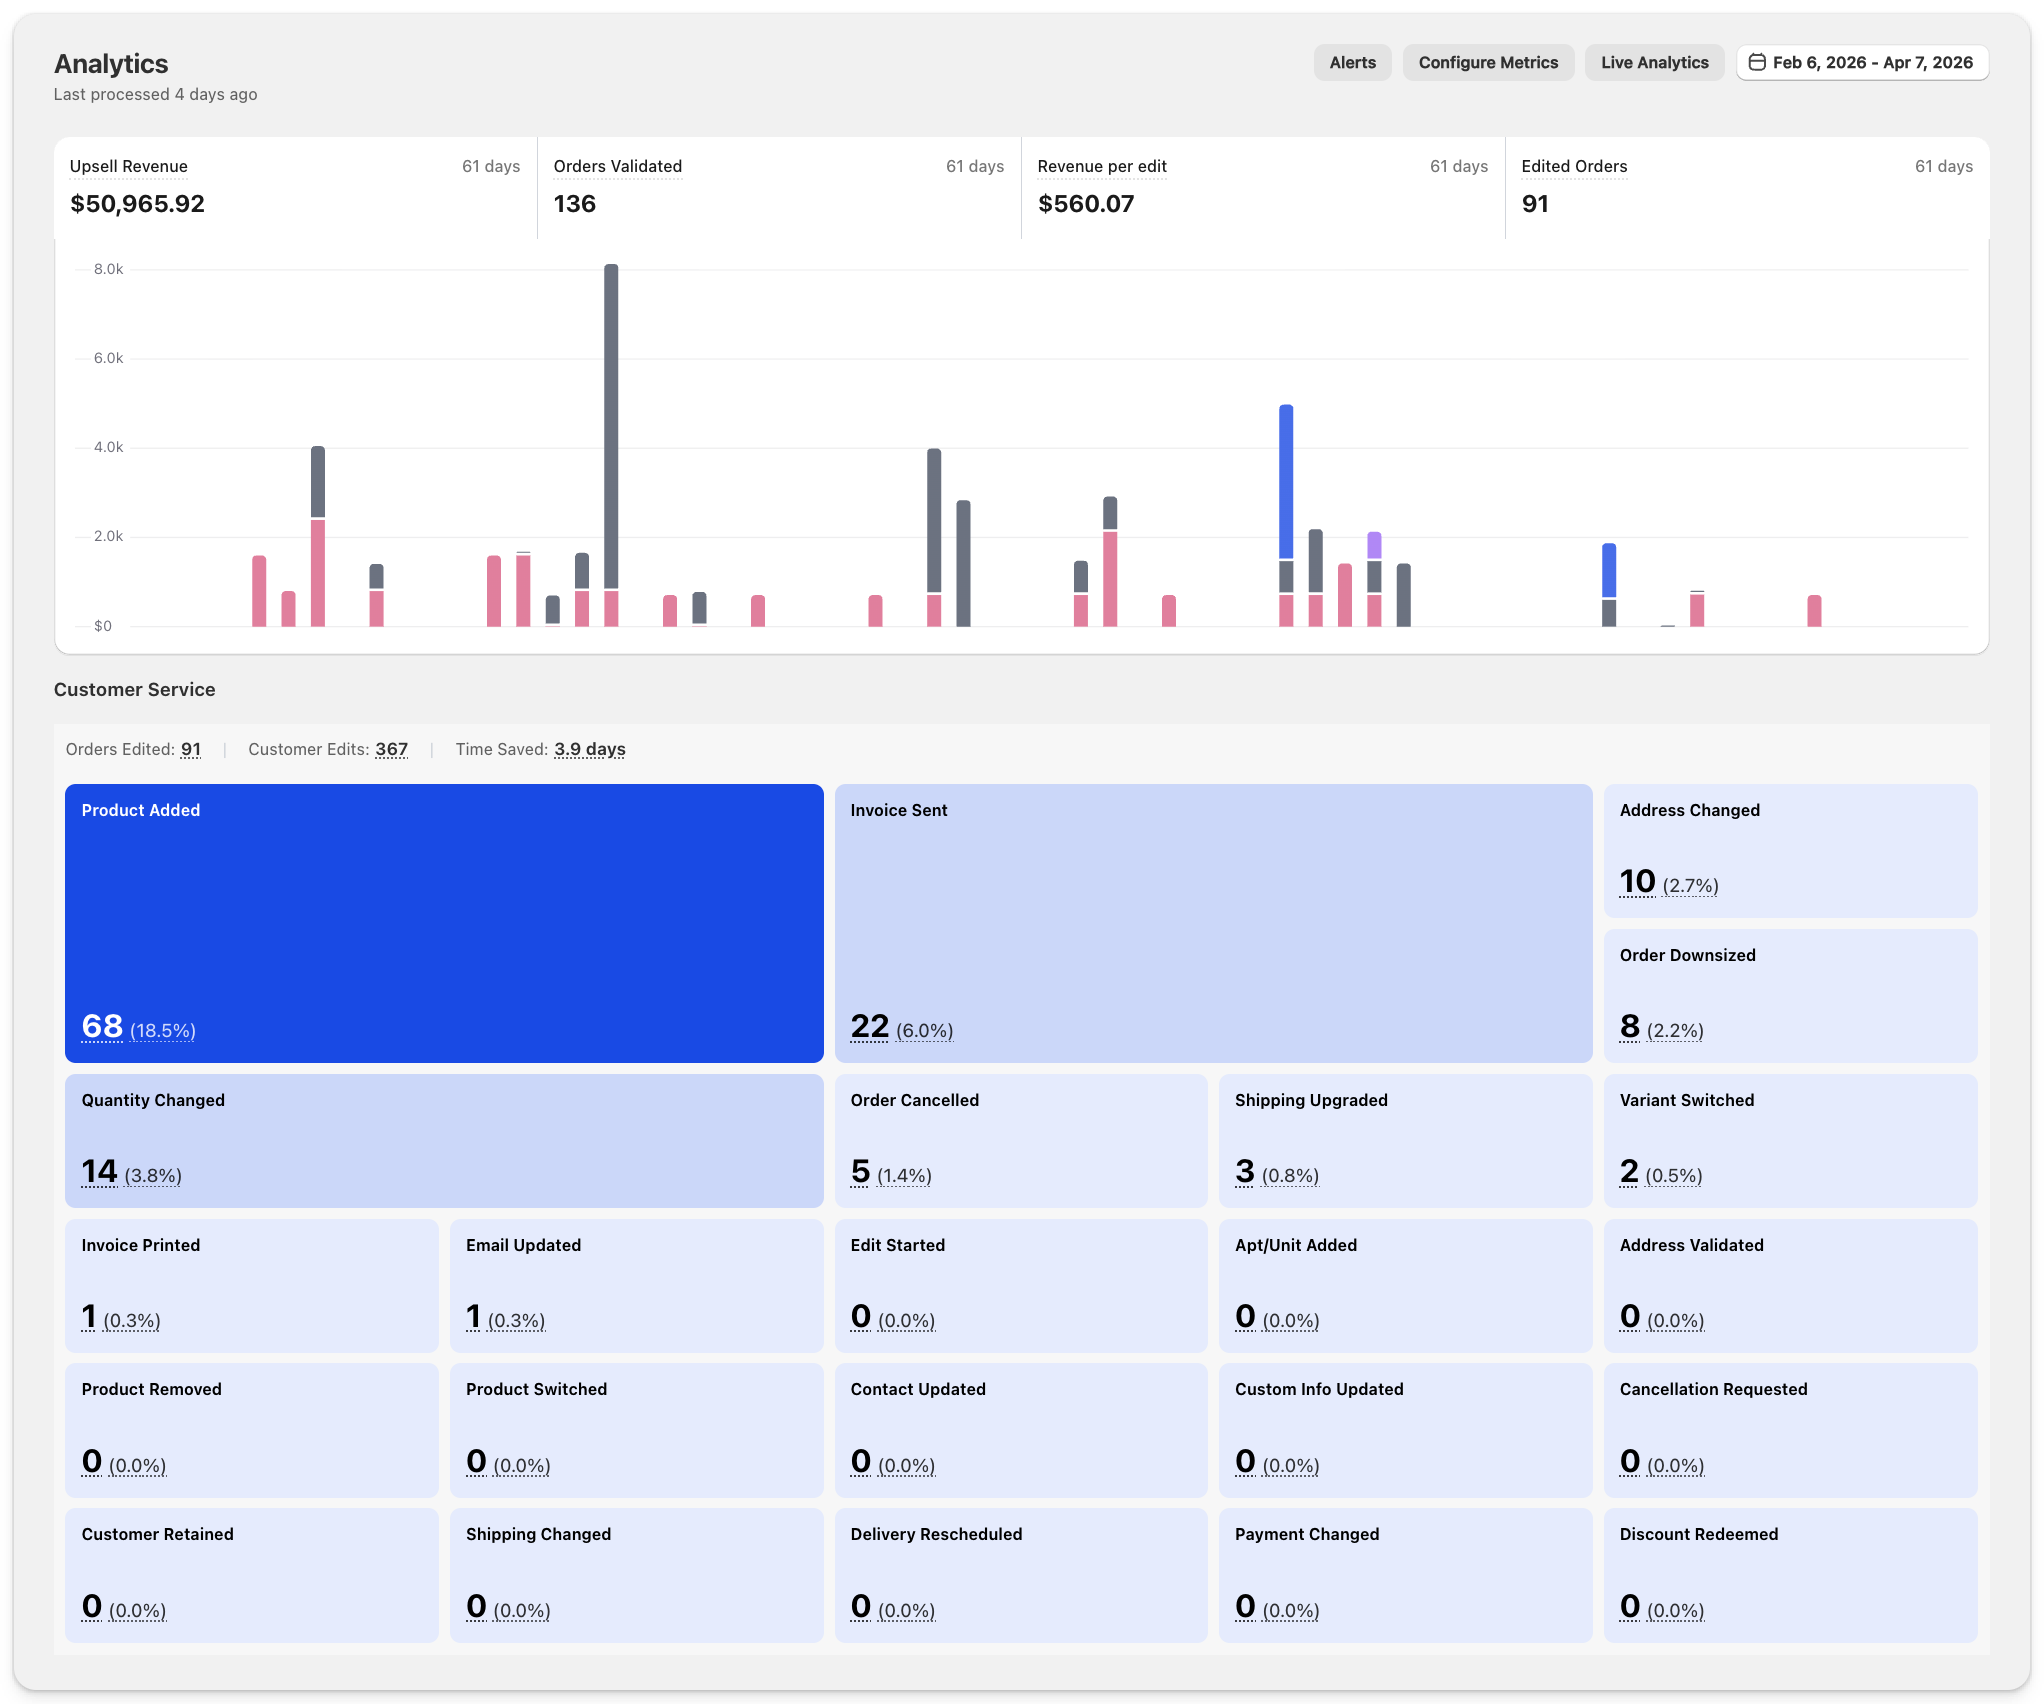
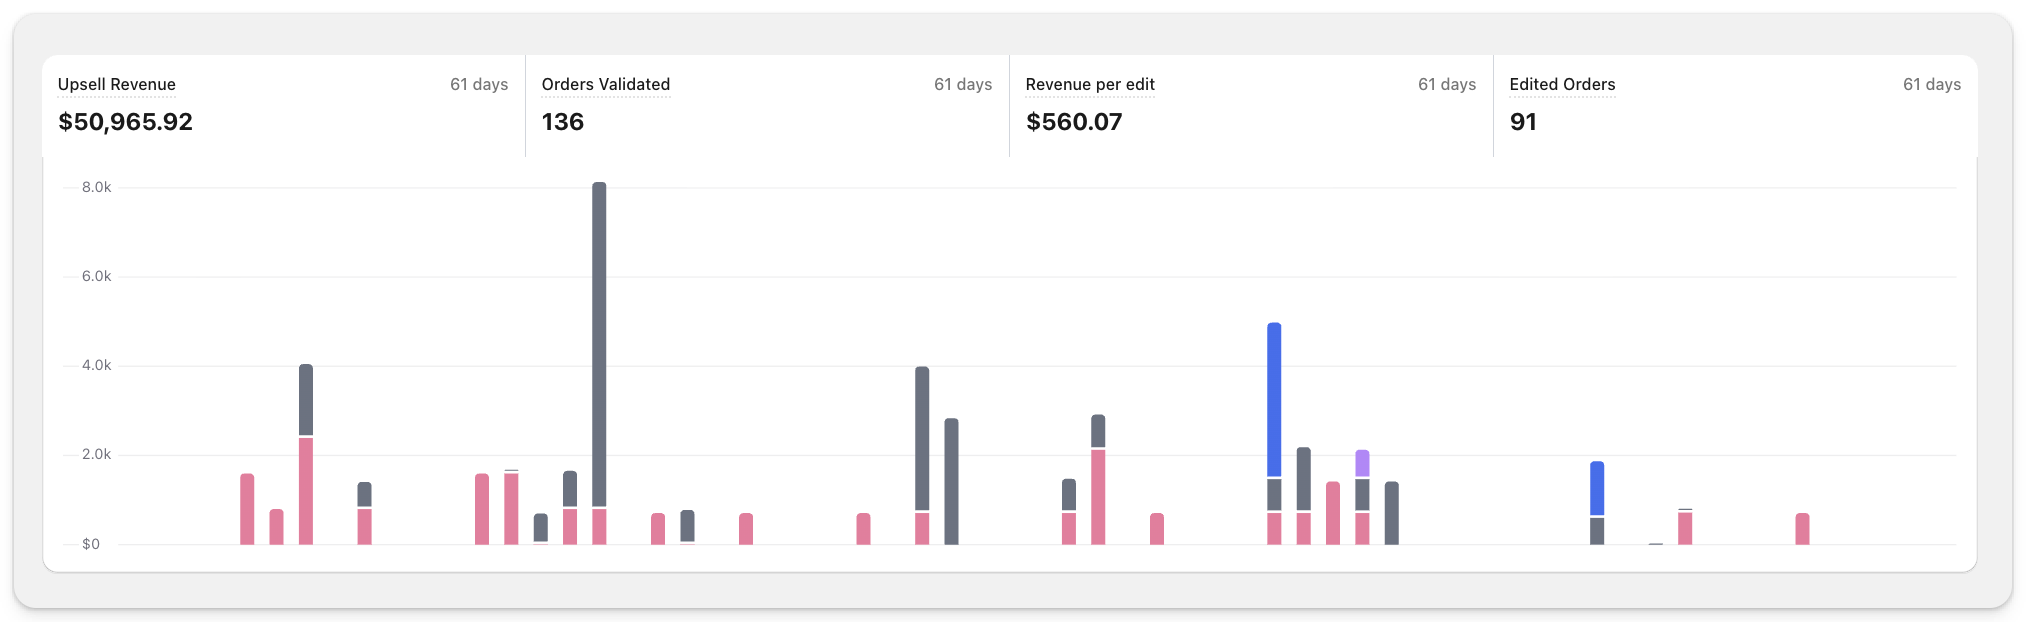
Summary Bar
The summary bar at the top of the dashboard gives you a snapshot of your key performance metrics for the selected date range.
Metric | What It Measures | How It's Calculated |
Upsell Revenue | Total revenue from paid upsell transactions. Includes products added after checkout and revenue attributed to Order Editing upsell placements. | Sum of settled upsell revenue |
Orders Validated / Time Saved / Cost Saved | This card changes based on your data and configuration. If address validation has activity, it shows Orders Validated. Otherwise, it shows Time Saved or Cost Saved for self-service edits. | Validated orders count, or edits multiplied by your configured savings values |
Revenue per Edit | Average upsell revenue generated each time a customer edits their order. Higher values indicate effective product recommendations. | Total upsell revenue ÷ Total completed edits |
Edited Orders | Number of unique orders where customers completed at least one edit. Edits include address changes, product modifications, shipping updates, and more. | Count of unique orders with completed edit sessions |
� Click a summary metric to switch the chart below the summary bar. Hover over a metric to see how it's calculated.
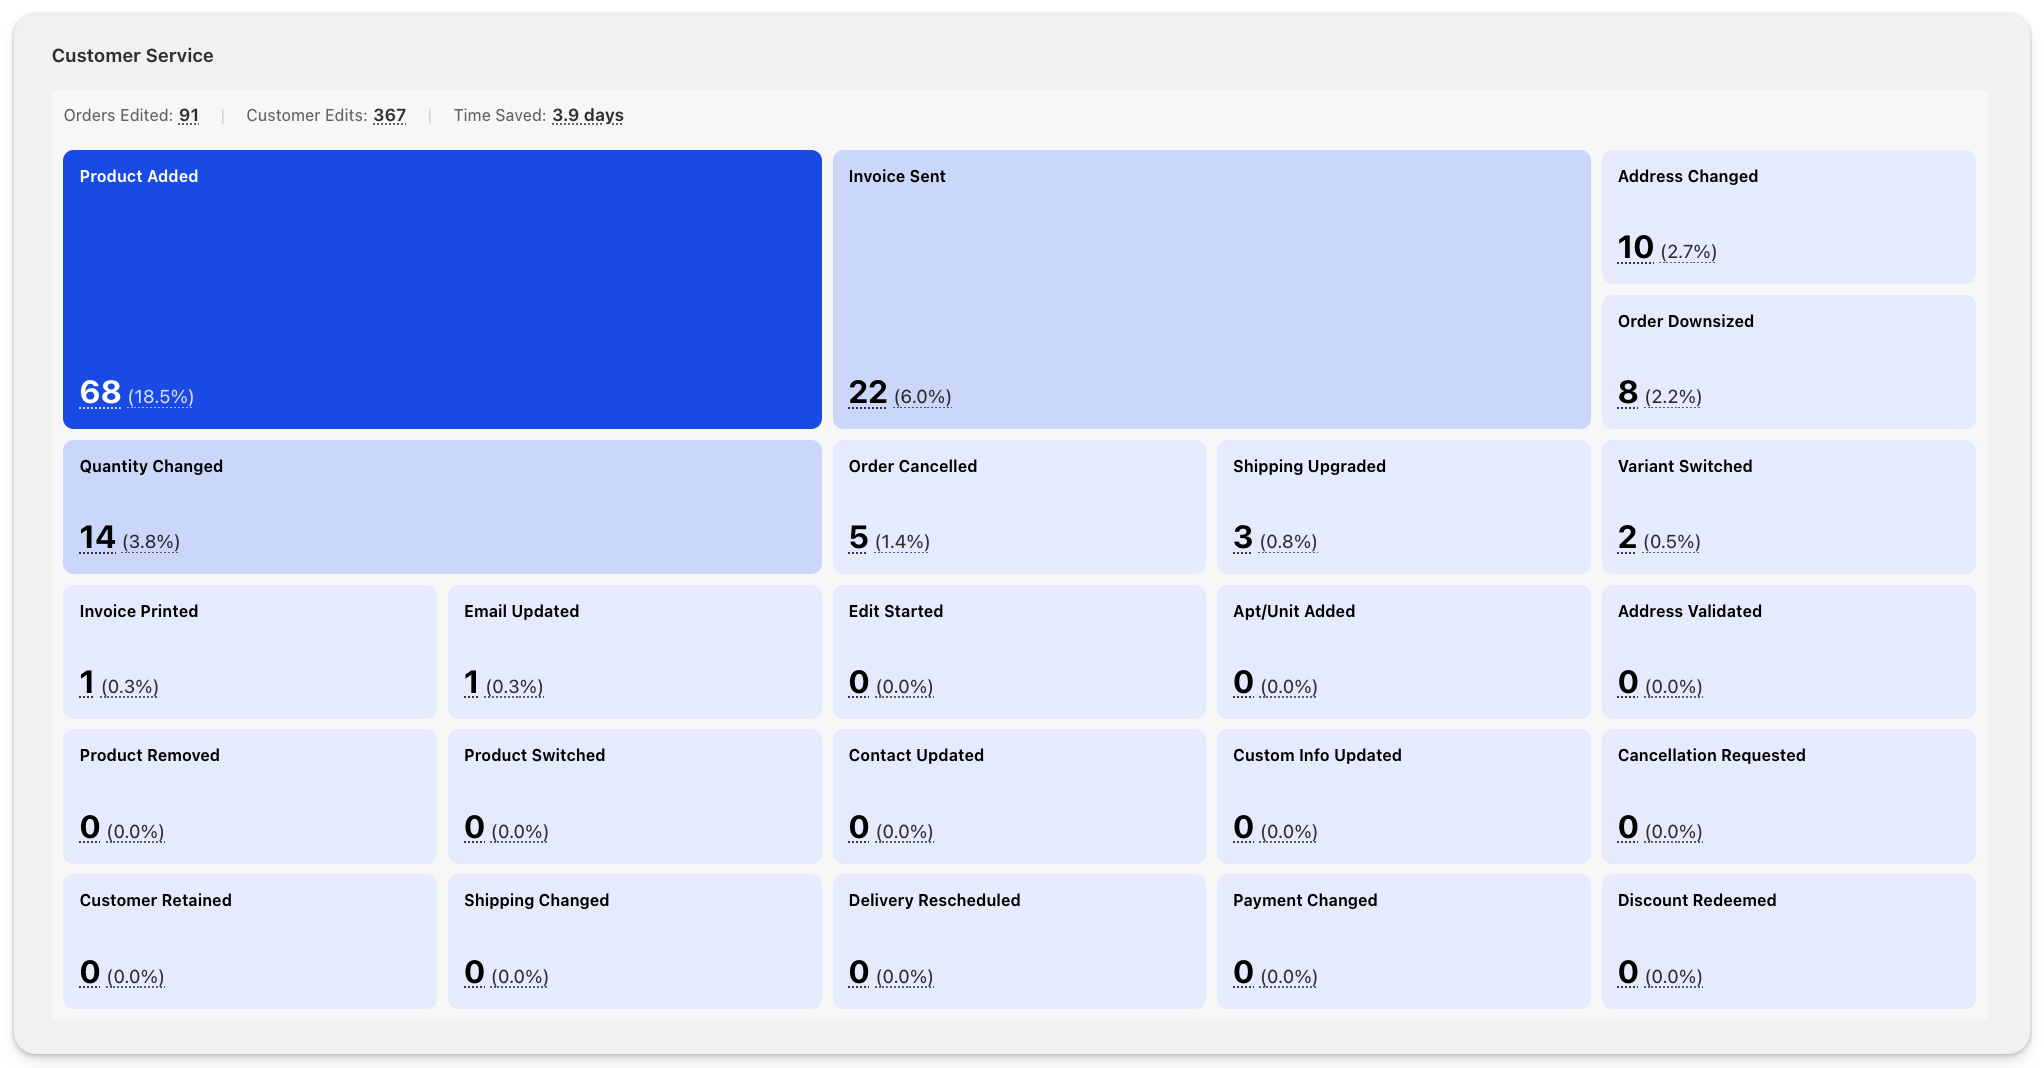
Customer Service
The Customer Service section shows exactly how customers are using your self-service editing features. This is where you measure the impact Order Editing has on reducing your support workload.
Overview Metrics
At the top of the Customer Service section, you will see three key figures:
- Orders Edited counts the number of unique orders that were edited (one order with multiple edits still counts as one).
- Customer Edits counts the total number of edit actions performed. A single order can have multiple edits, so this number is typically higher than Orders Edited.
- Time Saved (or Cost Savings, depending on your configuration) shows the estimated support time or money saved by customers editing their own orders instead of contacting your team.
Edit Type Grid
Below the overview, a grid displays every type of edit customers have made, along with the count and percentage of total edits. This tells you exactly what customers are changing most often.
Edit types include:
Category | Edit Types |
Product Edits | Product Added, Product Removed, Quantity Changed, Variant Switched, Product Switched |
Address Edits | Address Changed, Apt/Unit Added, Address Validated |
Shipping and Delivery | Shipping Upgraded, Shipping Changed, Delivery Rescheduled |
Order Changes | Order Cancelled, Order Downsized, Cancellation Requested, Customer Retained, Discount Redeemed |
Contact and Info | Email Updated, Contact Updated, Custom Info Updated, Payment Changed |
Documents | Invoice Sent, Invoice Printed |
� The most common edit type is highlighted in blue on your dashboard. Use this to understand what your customers need most, and make sure those features are prominently enabled.
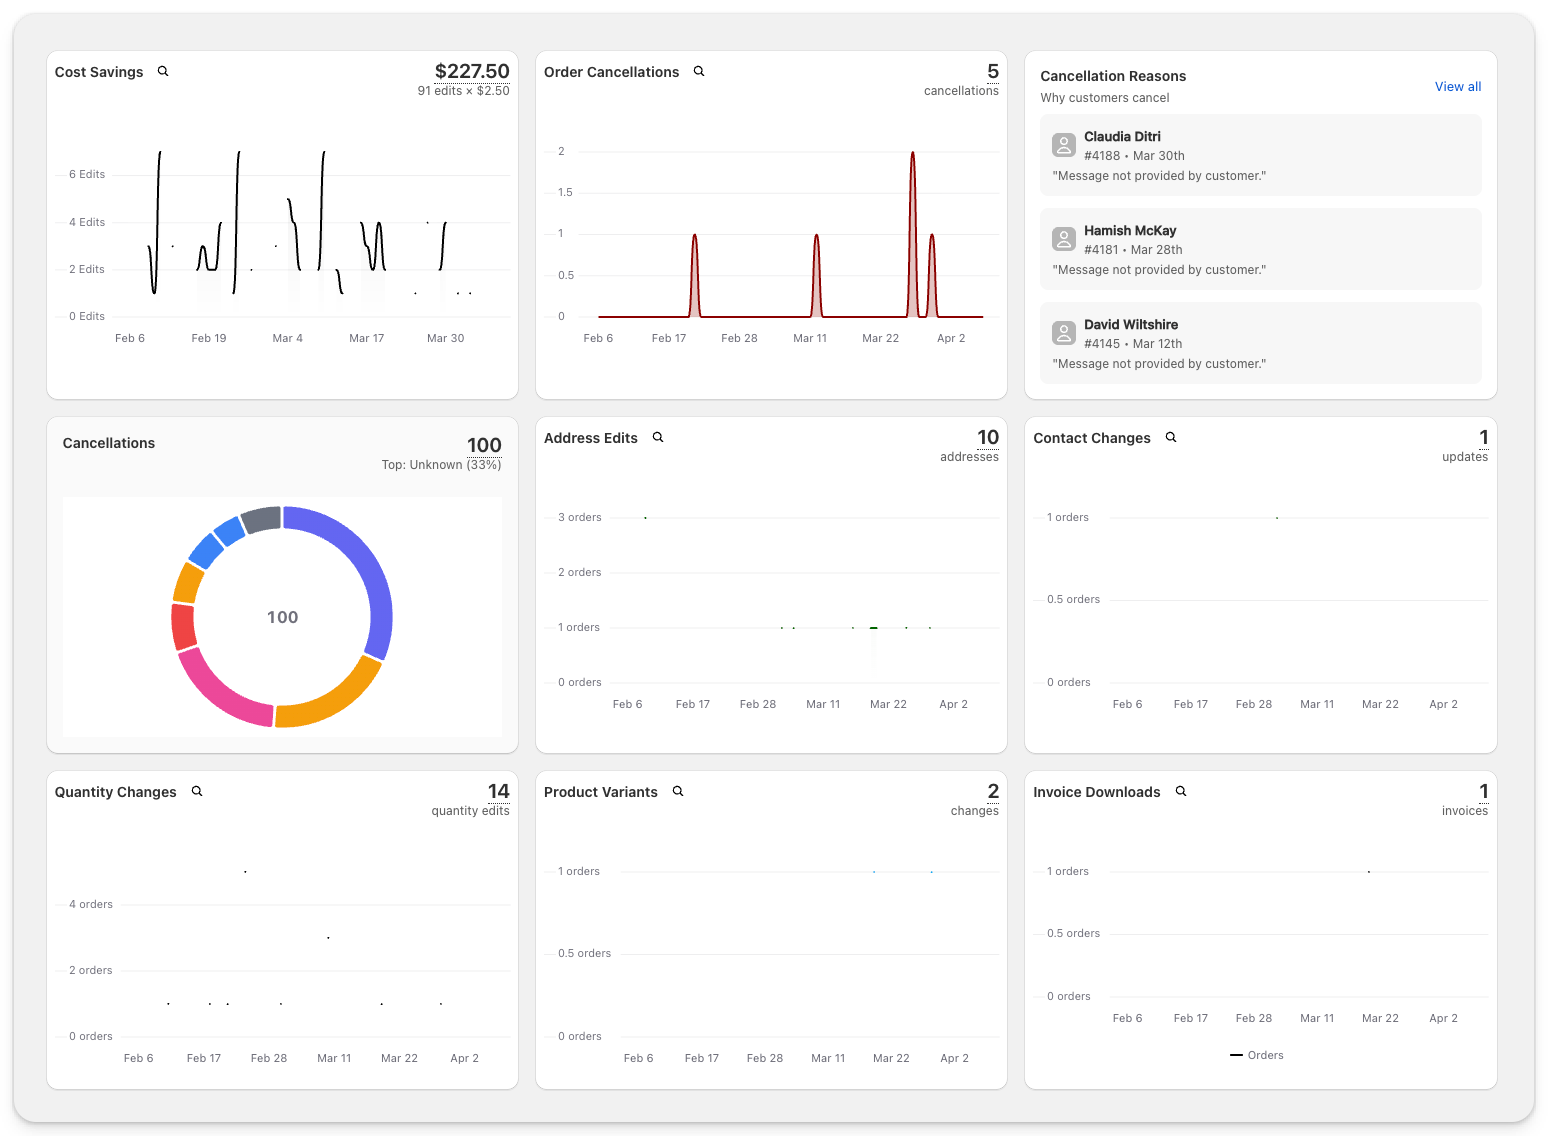
Customer Service Charts
Below the grid, you will find trend charts that visualise your editing data over time. Each chart shows activity for the selected date range and helps you spot patterns or spikes.
Available charts
- Cost Savings (or Time Saved): Shows the cumulative value of self-service edits over time, based on your configured cost or time per edit type.
- Order Cancellations: Tracks how many orders were cancelled through self-service, with a trend line over the date range.
- Cancellation Reasons: Lists individual cancellations with the customer name, order number, date, and the reason provided (if any).
- Cancellations (Donut Chart): Breaks down cancellation reasons by percentage so you can see the top drivers at a glance.
- Address Edits: Number of address changes over time.
- Contact Changes: Number of contact information updates over time.
- Quantity Changes: Number of quantity edits over time.
- Product Variants: Number of variant switches over time.
- Invoice Downloads: Number of invoices downloaded by customers over time.
Sales Channel
The Sales Channel section gives you a high-level view of your overall upsell performance across all strategies combined. For a detailed breakdown of how each individual strategy is performing, see the Upsell Strategy Analytics article.
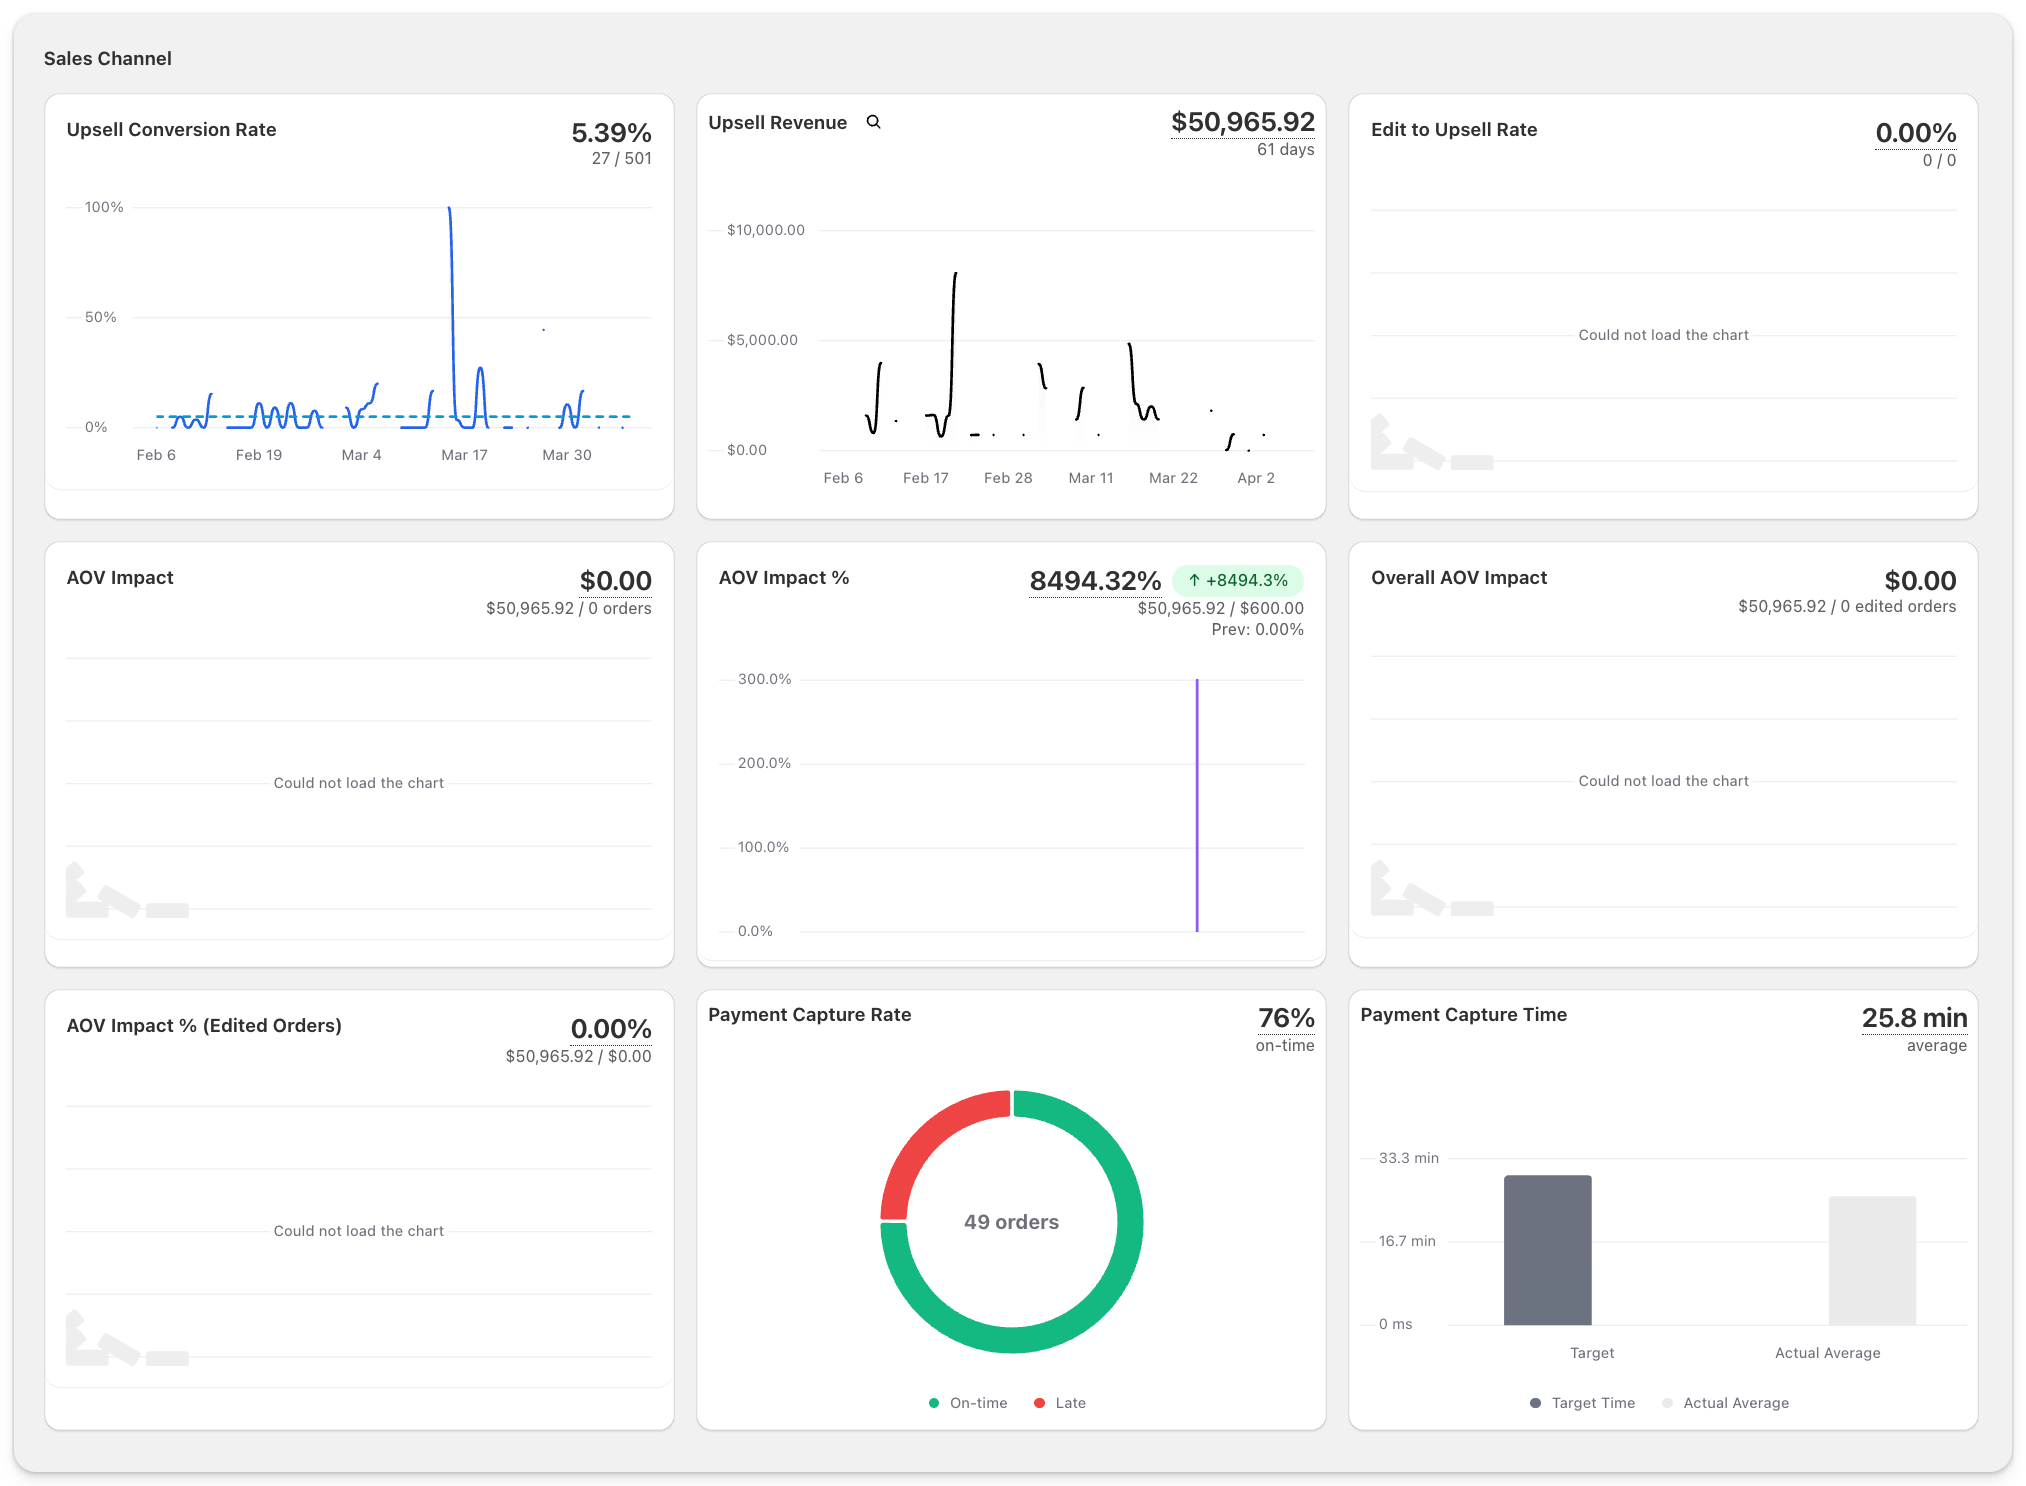
Upsell Performance Metrics
Metric | What It Measures |
Upsell Conversion Rate | Percentage of unique sessions that saw an upsell and accepted it. This is one of the most important upsell metrics. |
Views | Unique sessions that viewed upsells. Use this alongside conversion rate to understand reach vs effectiveness. |
Upsell Revenue | Total revenue from settled upsell transactions across your active upsell placements, such as Product List Upsell, Free Shipping Upsell, One-Click Upsell, Product Carousel, Featured Product Upsell, and Customer Accounts. |
AOV Impact Metrics
Metric | What It Measures |
AOV Impact | The dollar increase in average order value attributed to upsells. |
AOV Impact % | The percentage increase in average order value from upsells. |
Overall AOV Impact | The dollar AOV impact calculated across all edited orders. |
AOV Impact % (Edited Orders) | The percentage AOV increase specifically for orders that were edited. |
Payment and Capture Metrics
Metric | What It Measures |
Payment Capture Rate | Percentage of upsell payments captured on time vs late. Displayed as a donut chart showing on-time vs late captures. |
Payment Capture Time | Average time to capture upsell payments, shown against your target time. Lower is better. |
Top Upsell Products
At the bottom of the Sales Channel section, you will see your top-performing upsell products ranked by revenue and units sold. Use this to understand which products convert best as upsells and refine your product recommendations.
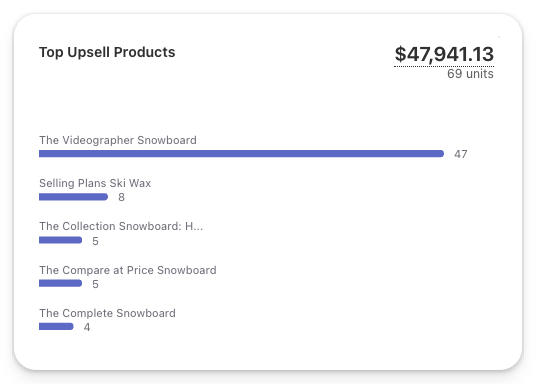
� Hover over the revenue chart to see the revenue breakdown by placement for that period.
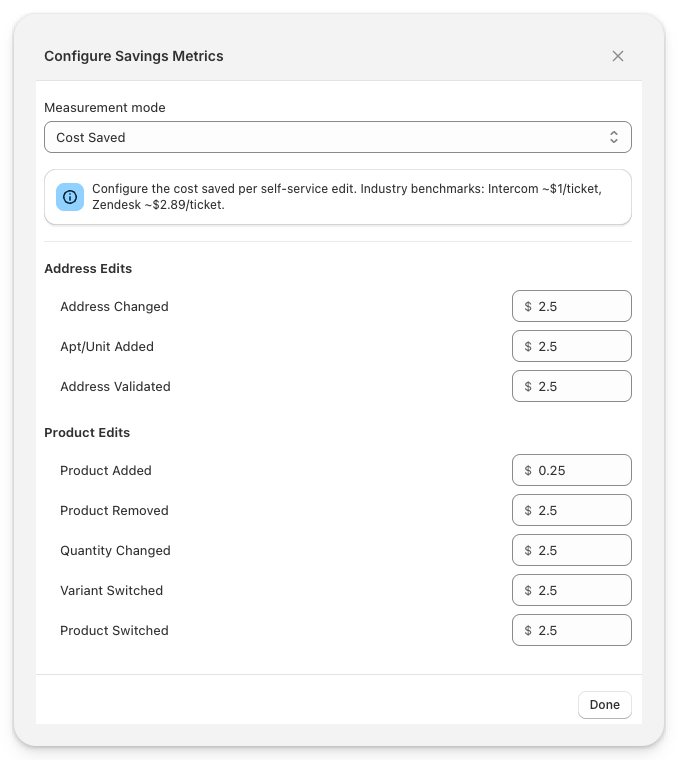
Configure Metrics
Click Configure Metrics in the top-right corner of the dashboard to customise how Order Editing calculates your savings. You can choose between two measurement modes.
Time Saved Mode
Measures the support time saved by each self-service edit. Configure the number of minutes each edit type would typically take your support team to handle manually. The dashboard then calculates total time saved across all edits.
Default values for Time Saved mode:
Edit Type | Default Minutes |
Address Changed | 5 min |
Apt/Unit Added | 5 min |
Address Validated | 5 min |
Product Added | 2 min |
Product Removed | 5 min |
Quantity Changed | 5 min |
Variant Switched | 5 min |
Product Switched | 5 min |
Cost Saved Mode
Measures the dollar cost saved per self-service edit. Configure the cost your team would typically spend handling each edit type as a support ticket. The dashboard multiplies total edits by cost per ticket to show your total savings.
� Industry benchmarks for support ticket costs: Intercom ~$1/ticket, Zendesk ~$2.89/ticket. Use these as a starting point and adjust based on your own team's costs.
The formula is: Total Edits x Cost per Ticket = Total Savings
For example, if you had 111 edits at $2.50 per ticket, your total cost savings would be $277.50.
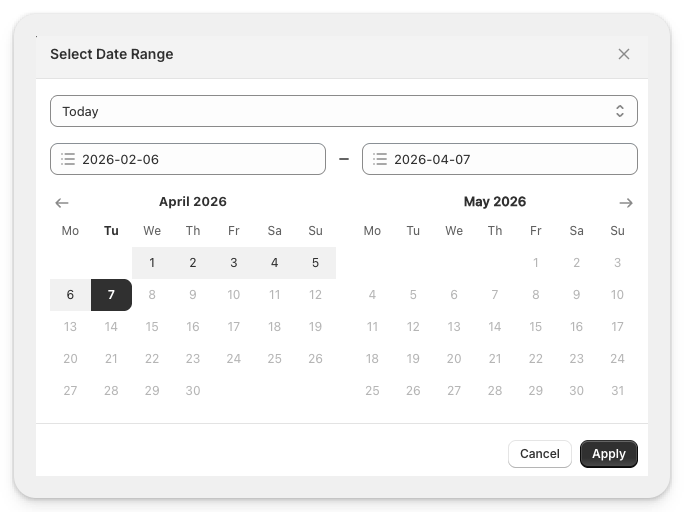
Date Range and Filtering
Click the date range selector in the top-right corner to change the time period displayed across the entire dashboard. You can choose from preset options like "Today" or set a custom date range using the calendar picker.
All metrics, charts, and calculations update automatically when you change the date range. The number of days in your selected range is displayed next to each summary metric.
Optimising with Analytics
Successful merchants use analytics to refine their approach through a simple cycle: measure current performance, identify what works, test improvements, and refine based on results.
Cadence | What to Review | Why It Matters |
Weekly | Review engagement rates and investigate any drops in edit or upsell activity. | Quick adjustments prevent revenue losses before they compound. |
Monthly | Analyse which upsell strategies generate the most revenue and prioritise optimisation efforts. | Focus your time on what moves the needle most. |
Quarterly | Examine long-term trends, disable underperforming features, and expand high-performing offerings. | Strategic decisions based on enough data to be confident. |
Frequently Asked Questions
Where do I find the Analytics Dashboard?
Navigate to Order Editing > Analytics in your Shopify admin. The dashboard is accessible from the left-hand settings menu in your Order Editing app.
Do I need to set up anything for analytics to work?
No. Standard analytics start tracking automatically as customers use Order Editing. The only optional setup is configuring your savings metrics. Some advanced charts and longer date ranges may ask you to grant extra Shopify permissions inside the app.
What is the difference between the Analytics Dashboard and the Upsell Strategies page?
The Analytics Dashboard (Settings > Analytics) is your central hub for all app analytics, covering self-service edits, support savings, and overall upsell performance. The Upsell Strategies page (Order Editing > Upsell Strategies) focuses specifically on individual strategy performance, letting you compare strategies side-by-side, view per-strategy impressions and conversion rates, and manage your active strategies.
What is the difference between Orders Edited and Customer Edits?
Orders Edited counts the number of unique orders that had at least one edit. Customer Edits counts the total number of individual edit actions. For example, if one customer changes their address and adds a product on the same order, that is 1 edited order but 2 customer edits.
How is Revenue per Edit calculated?
Revenue per Edit divides your total upsell revenue by the total number of completed edits. It shows the average upsell revenue generated each time a customer interacts with the editing experience. Higher values indicate your product recommendations are working well.
What placements does Upsell Revenue include?
Upsell Revenue includes settled upsell transactions across your active upsell placements, such as Product List Upsell, Free Shipping Upsell, One-Click Upsell, Product Carousel, Featured Product Upsell, and Customer Accounts. You can hover over the revenue chart to see the breakdown by placement.
Can I switch between Time Saved and Cost Saved?
Yes. Click Configure Metrics in the top-right corner and use the Measurement Mode dropdown to switch between Time Saved and Cost Saved. Your dashboard will update to reflect the selected mode. You can switch back and forth at any time.
How often does the dashboard update?
The dashboard shows a "Last processed" timestamp at the top. Data is processed regularly throughout the day.
Why are some of my AOV Impact metrics showing $0.00?
AOV Impact metrics require both upsell revenue and edited order data to calculate. If customers are accepting upsells but not editing their orders (or vice versa), some AOV calculations may show as $0.00. This is normal and reflects the specific relationship between edits and upsells.